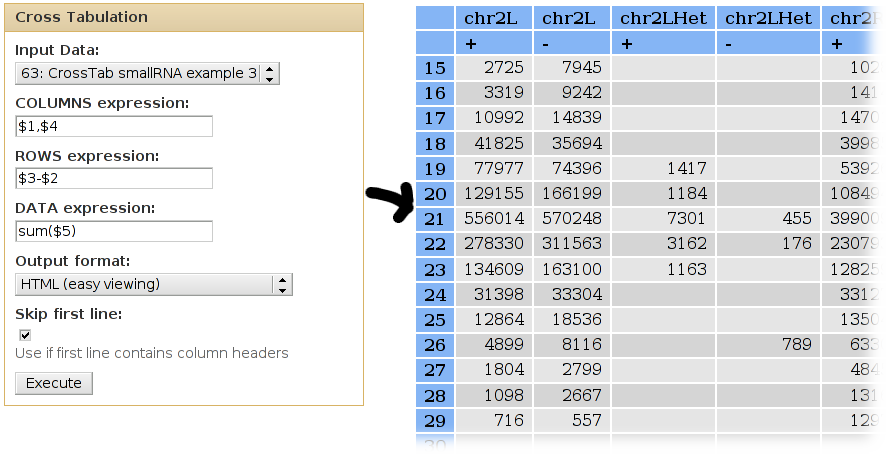
Simple version
What it does
This tool calculates a cross-tabulation for two variables in a input dataset.
Cross-Tabulation is commonly known as Data Pilot in OpenOffice Calc, and as Pivot Tables in Microsoft Excel.
For general information about cross-tabulations, see http://en.wikipedia.org/wiki/Cross_tabulation and http://en.wikipedia.org/wiki/Pivot_table
For advanced cross-tabulation options (e.g. more than two variables), see the hierarchical and the advanced versions of the cross-tabulation tool (available under the same category).
Example 1
Given the following (made up) list of intervals (columns are: chrom,start,end,strand,score):
chr2L       5109145 5158264 +       23
chr2L       5151748 5186162 +       84
chr2L       5109145 5205690 +       58
chr2L       2250532 2251270 -       19
chr2L       2156483 2178749 -       81
chr3L       6896829 6906661 +       17
chr2L       6686818 6709080 -       48
chr3L       6674636 6676635 -       15
chr2L       6663964 6674790 +       36
chr3LHet    6527448 6546972 -       49
chrU        60709   60739   +       91
...
...
...
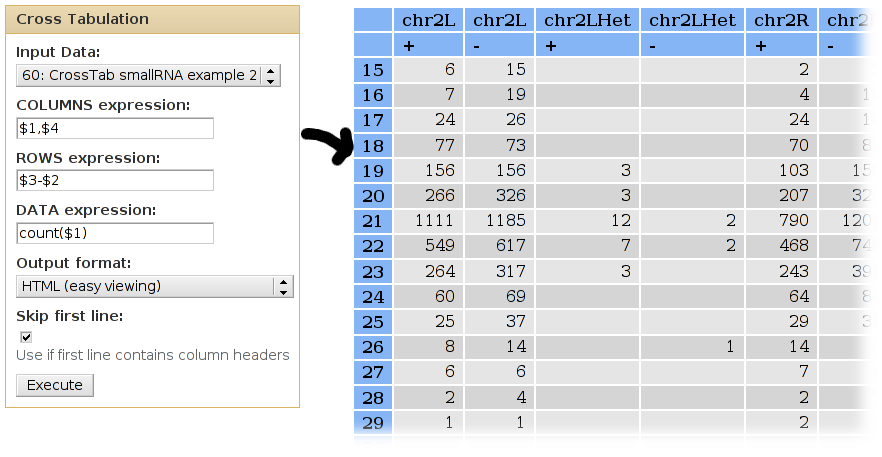
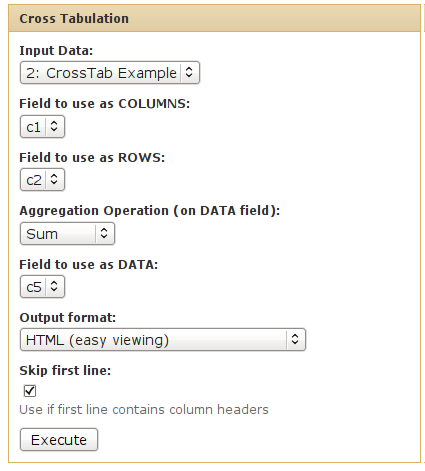
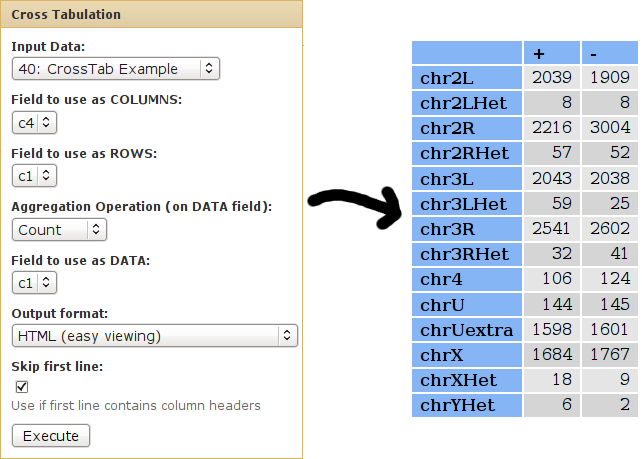
We can use cross-tabulation to see a contingency table of chromosome vs. strand:
- The strand information (column 4) will be listed as COLUMNS.
- The chromsomes (column 1) will be listed in the ROWS.
- We want to COUNT the occurences of each chrom/strand pair (when counting, it doesn't matter which column is used as the DATA column).
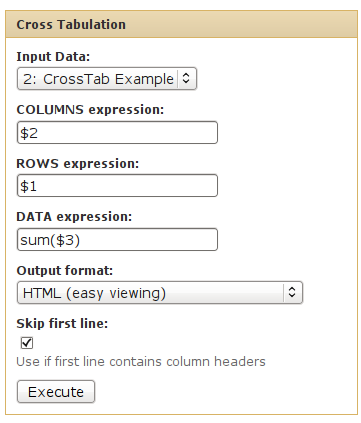
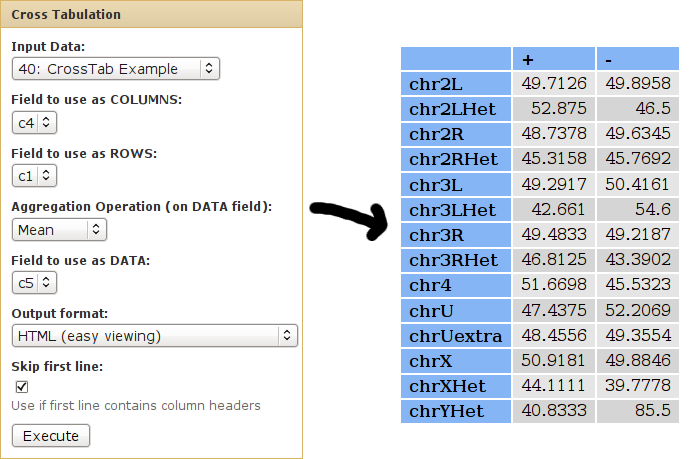
We can use cross-tabulation to find the mean score for each chrom/strand pair:
- The strand information (column 4) will be listed as COLUMNS.
- The chromsomes (column 1) will be listed in the ROWS.
- We want to calculate the MEAN score of each chrom/strand pair - the actual score value is found in column 5.
Example 2
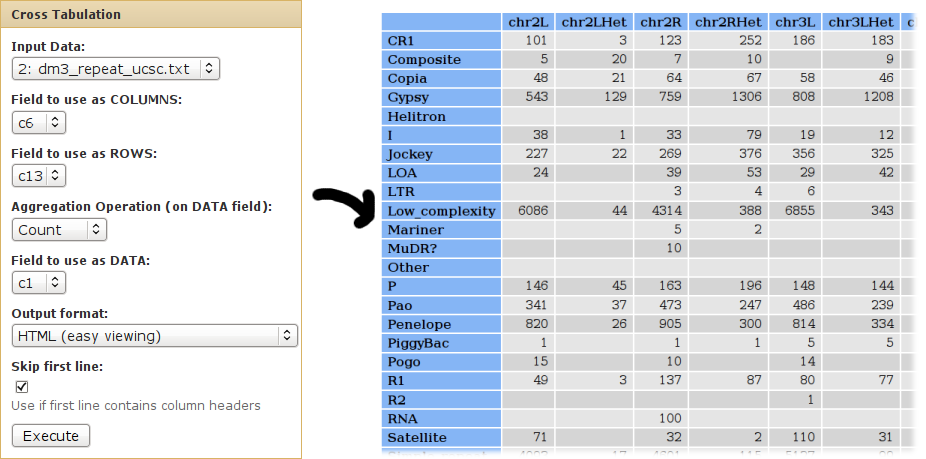
With the Repeat Masker track for D. Melanogaster 3 (downloaded from UCSC's Table Browser):
585 1620    0       0       3       chrXHet 0       660     -203452 +       (TAGA)n Simple_repeat   Simple_repeat   1       657     0       1
585 211     259     12      24      chrXHet 1985    2104    -202008 +       A-rich  Low_complexity  Low_complexity  1       117     0       1
585 787     66      241     11      chrXHet 2860    3009    -201103 -       DNAREP1_DM      LINE    Penelope        0       594     435     1
585 1383    78      220     0       chrXHet 3012    3320    -200792 -       DNAREP1_DM      LINE    Penelope        -217    377     2       1
585 244     103     0       0       chrXHet 3737    3776    -200336 -       DNAREP1_DM      LINE    Penelope        -555    39      1       1
585 48      60      0       0       chrXHet 6431    6514    -197598 +       AT_rich Low_complexity  Low_complexity  1       83      0       1
585 29      47      0       0       chrXHet 6561    6604    -197508 +       AT_rich Low_complexity  Low_complexity  1       43      0       1
585 26      30      0       0       chrXHet 7625    7658    -196454 +       AT_rich Low_complexity  Low_complexity  1       33      0       1
585 2270    83      144     0       chrXHet 7907    8426    -195686 +       DNAREP1_DM      LINE    Penelope        1       594     0       1
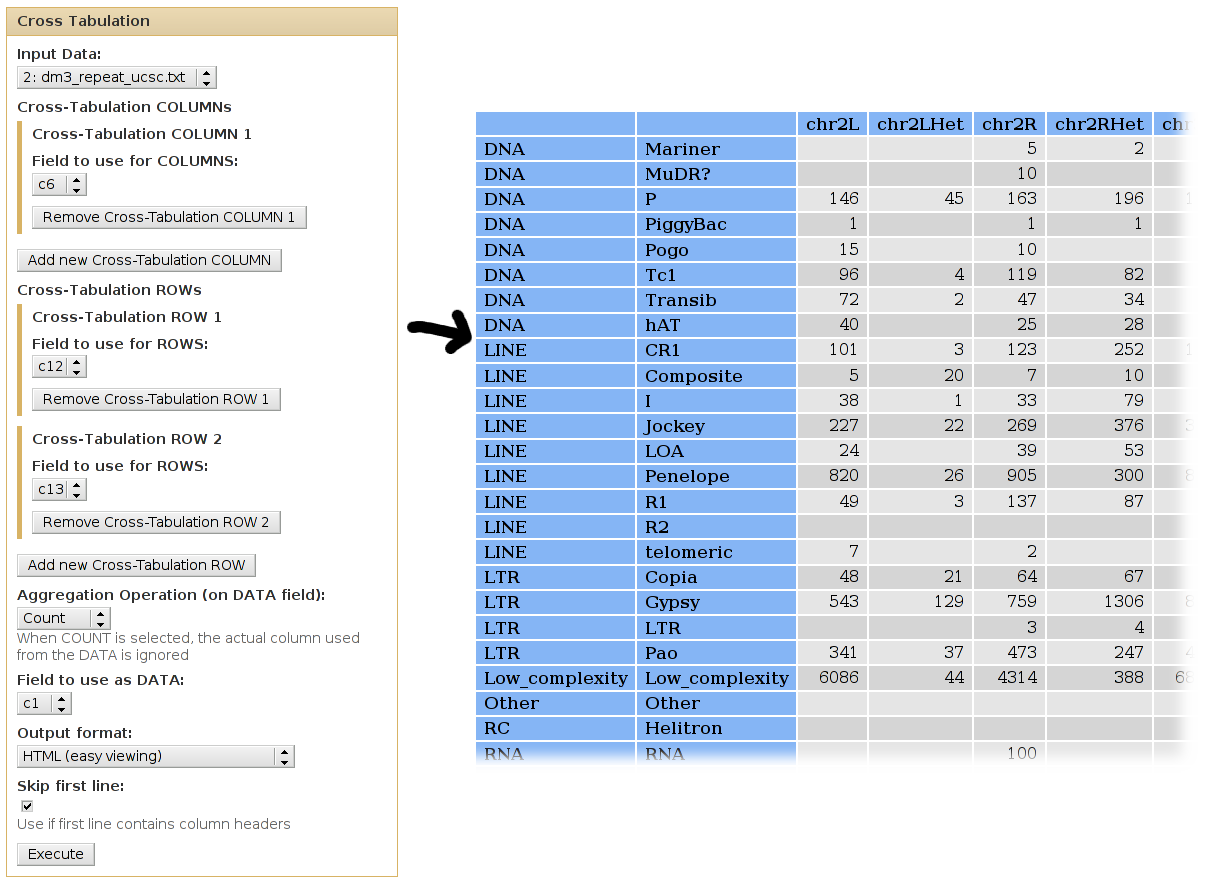
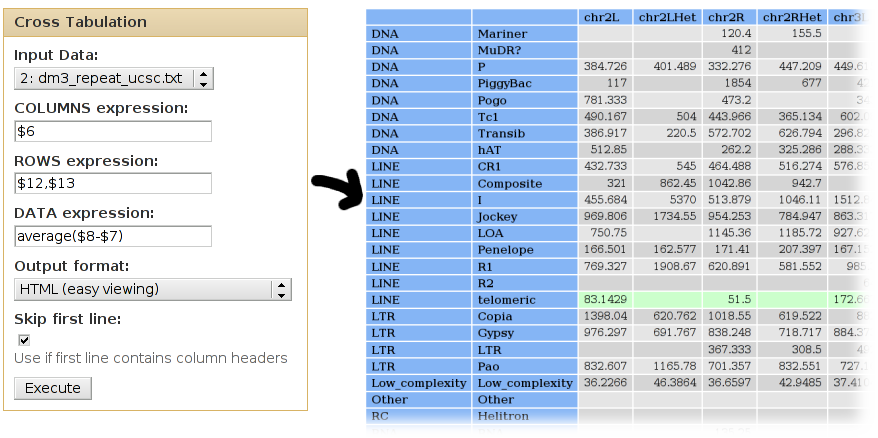
We can use cross-tabulation to count how many families are in each chromosome:
- The chromosomes (column 6) will be listed as COLUMNS.
- The families (column 13) will be listed in the ROWS.
- We want to COUNT the occurences of each chrom/class pair (when counting, it doesn't matter which column is used as the DATA column).
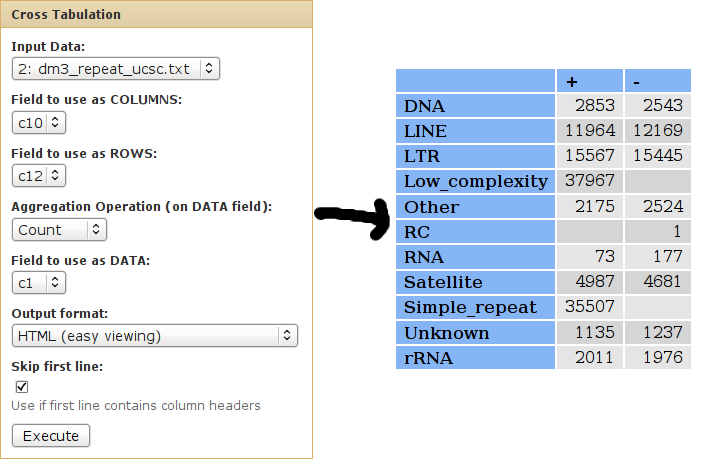
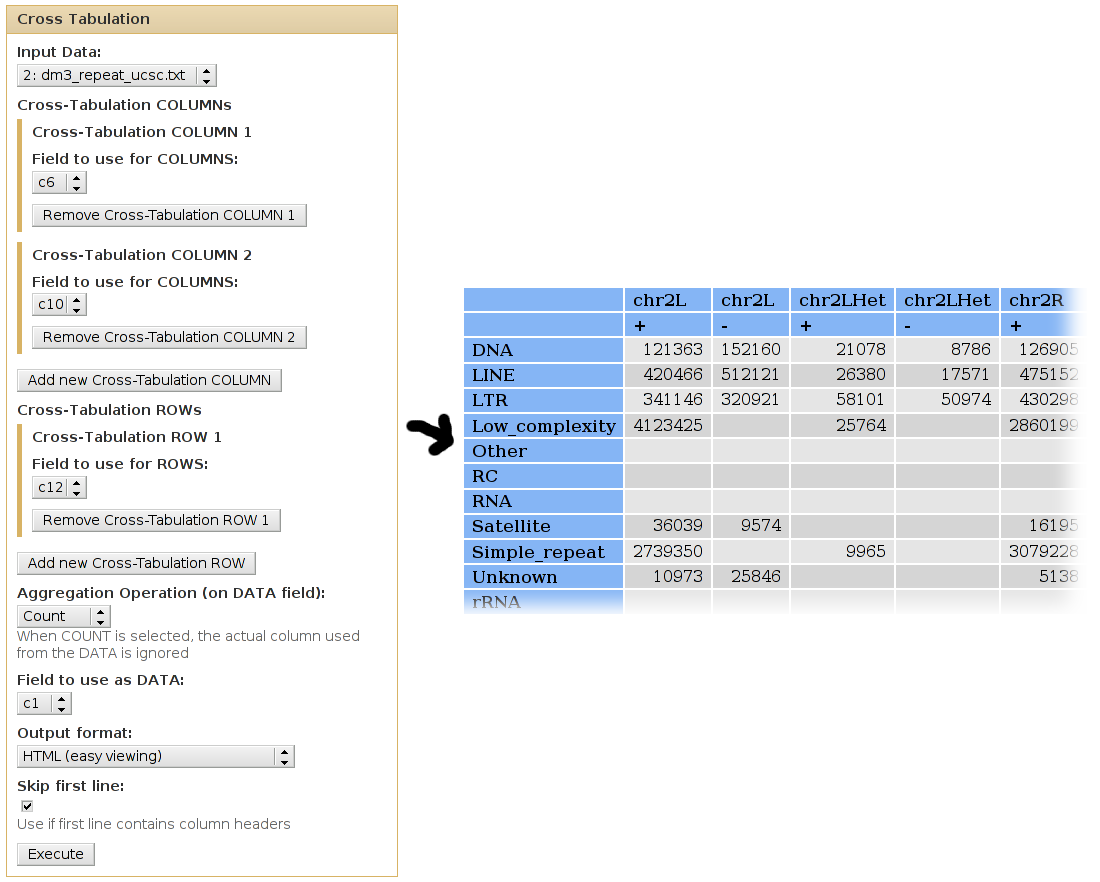
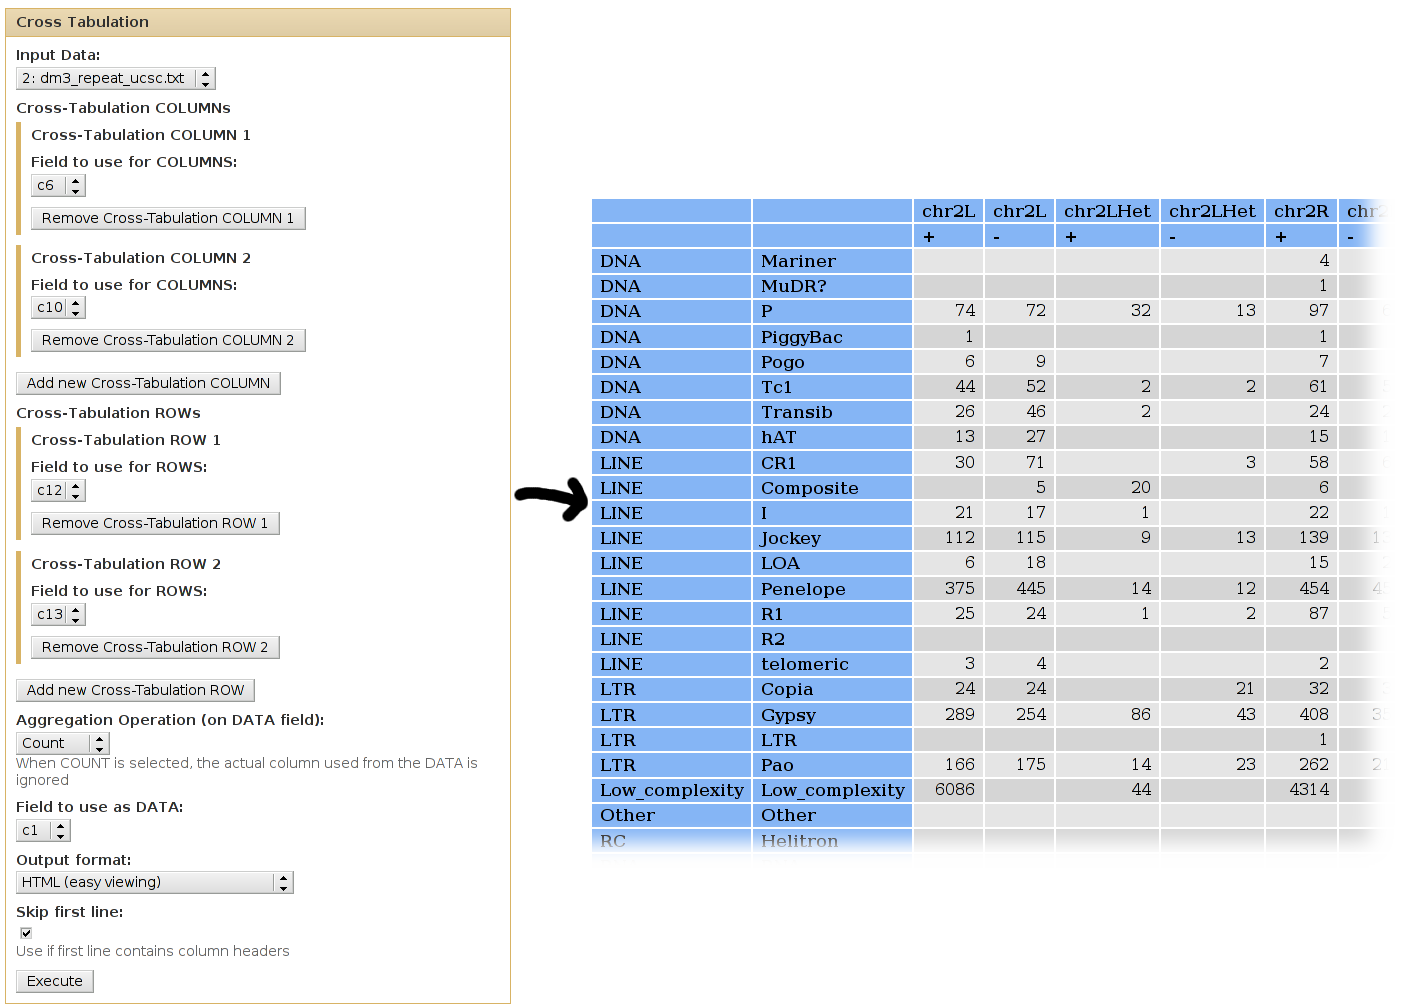
We can use cross-tabulation to see distribution of classes in the positive/negative strands:
- The strand infromation (column 10) will be listed as COLUMNS.
- The classes (column 12) will be listed as ROWS.
- We want to COUNT the occurences of each family/strand pair (when counting, it doesn't matter which column is used as the DATA column).